Introduction
2023rve is the designation given to a Type II supernova discovered on 2023-09-08 by Mohammad Odeh from UAE. It appears to be part of NGC 1097, a galaxy 45 million light years away. Due to it’s brightness, 2023rve was visible to budget amateur astronomers/astrophotographers like myself.
Below is my first image of 2023rve.
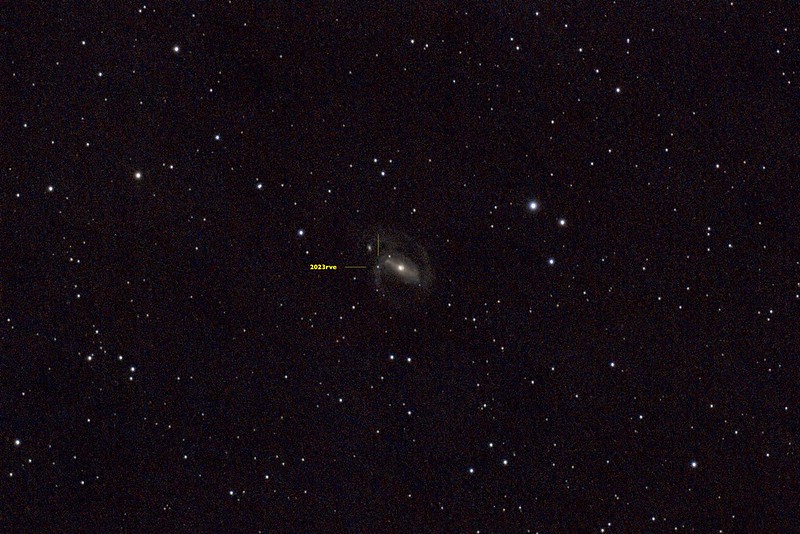
This is a stacked image consisting of 64x60s exposures captured using an unmodified Canon 800D attached to an Evostar 72ED. I was and continue to be very excited about this image because supernovas occur but rarely and are generally out of reach for budget setups like mine. Catching glimpse of one is not unlike seeing an unicorn.
Light Curves
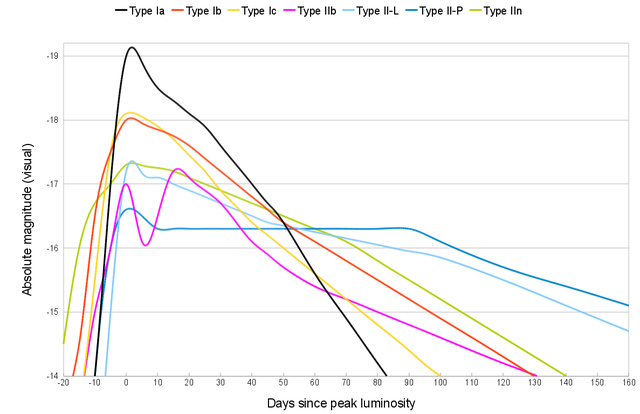
2023rve is a type II supernova, and its light curve will look like one of the following depending on its subclassification (II-P, II-L, IIn or IIb).
It occurred to me then that with sufficient images I can have a go at generating such a light curve and figure out what kind of supernova 2023rve is! This is a particular exciting idea to me because it takes supernovas from the realm of theory (knowing about them) into reality (studying them).
In the time since then, I managed 4 captures in total, including the one above, and this post documents my efforts in estimating the magnitude of 2023rve from my data and using that to construct a light curve.
General Approach
The idea is to calibrate my data, which are 60 second exposures of 2023rve, against stars of known visual magnitude. By comparing the pixel values that make up 2023rve vs these calibration stars, I can estimate its apparent visual magnitude. Then, making the assumption 2023rve is part of NGC1097, we can use the distance to NGC1097 to calculate the absolute magnitude of 2023rve and generate a light curve.
Identifying Stars
The first step is to find stars and their known magnitudes. While bright stars such as Rigel or Sirius have well known magnitudes, the stars in the vicinity of NGC1097 are less well known and unnamed. In order to look up stars in astronomical databases, we need their right-ascension (RA) and declination (DEC) coordinates. These coordinates serve the same purpose as GPS coordinates of latitude and longitude: they unique identify a position in the sky.
To locate our stars, I loaded my images into Siril and carried out platesolving, a method of locating images within the sky by looking at the pattern of the stars within the image.

Once platesolving is completed, I saved the file as a FITS file which embeds the coordinate information into the file metadata. I then open the FITS file in AstroImageJ and by manually adjusting the upper and lower limits on the histogram in the image viewer and zooming in, I am able to get a good view of NGC1097.

By right clicking on the image, a link to SIMBAD will open which allows all known stellar objects in the vicinity to be queried. Using this, three objects with known visual magnitudes were identified and annotated.
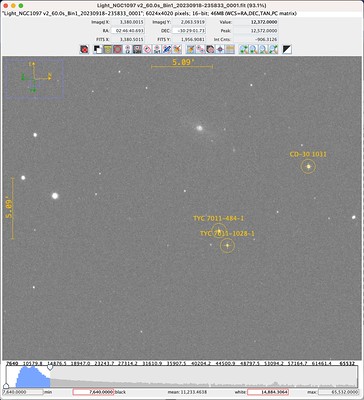
These are our reference stars and their visual magnitude is tabulated below.
| Object | Vmag |
|---|---|
| CD-30 1031 | 10.3 |
| TYC 7011-484-1 | 11.39 |
| TYC 7011-1028-1 | 12.15 |
Measuring Brightness
In order to relate the brightness of these stars to the measure pixel values, I used AstroImageJ’s single-aperture photometry tool, which samples a central circular region and an annulus around it. The central circular region should just fit the star while the annulus should contain only background. The background pixel value is estimated from the pixels within the annulus and subtracted from the stellar pixel values. This value is reported as Int Cnts. This measurement was done on each of the reference stars and 2023rve, e.g.

Deriving Visual Magnitude
Tabulating the Int Cnts obtained across the 4 observations produces the following:
| CD-30 1031 | TYC 7011-484-1 | TYC 7011-1028-1 | 2023rve | |
|---|---|---|---|---|
| 2023-09-18 | 1.09E+06 | 4.54E+05 | 2.43E+05 | 2.77E+04 |
| 2023-09-24 | 1.09E+06 | 4.67E+05 | 2.60E+05 | 2.49E+04 |
| 2023-11-18 | 9.65E+05 | 4.32E+05 | 2.64E+05 | 1.20E+04 |
| 2024-01-22 | 1.14E+06 | 5.47E+05 | 2.73E+05 | 1.06E+03 |
It is quite pleasing that the Int Cnts values for the three reference stars are relatively stable, particularly as I am not using an uncooled sensor nor did I control for atmospheric conditions. Of the three reference stars, TYC 7011-1028-1 had the fewest saturating pixels and was the most stable over time, and was chosen as the reference against which to measure 2023rve’s brightness:
| TYC 7011-1028-1 | 2023rve | (2023rve) / (TYC 7011-1028-1) | |
|---|---|---|---|
| 2023-09-18 | 2.43E+05 | 2.77E+04 | 0.114 |
| 2023-09-24 | 2.60E+05 | 2.49E+04 | 0.096 |
| 2023-11-18 | 2.64E+05 | 1.20E+04 | 0.045 |
| 2024-01-22 | 2.73E+05 | 1.06E+03 | 0.004 |
By expressing 2023rve’s brightness in terms of TYC 7011-1028-1 I am implicit assuming the my sensor’s response is approximately linear for the brightness being measured.
Magnitudes are logarithms of ratios, so the brightness ratio in the table above turns into a difference in magnitude given by mag_diff=-2.5log10(x)) where x are the values in the final column. By adding this value from the visual magnitude of TYC 7011-1028-1 we arrive at an estimated visual magnitude for 2023rve:
| (2023rve) / (TYC 7011-1028-1) | mag_diff | Vmag | |
|---|---|---|---|
| 2023-09-18 | 0.114 | 2.355 | 14.505 |
| 2023-09-24 | 0.096 | 2.545 | 14.695 |
| 2023-11-18 | 0.045 | 3.355 | 15.505 |
| 2024-01-22 | 0.004 | 6.030 | 18.180 |
Verification
The estimated visual magnitude of 2023rve looks quite reasonable, but is it correct? Thankfully professional astronomers have made their own measurements which I have collected below:
| Date | Vmag |
|---|---|
| 2023-09-06 | 14.5 |
| 2023-09-11 | 13.9 |
| 2023-09-16 | 14.43 |
| 2023-09-24 | 14.390 |
| 2023-11-15 | 15.500 |
| 2024-01-06 | 16 |
Sources:
- https://www.wis-tns.org/astronotes/astronote/2023-247
- https://www.rochesterastronomy.org/supernova.html#2023rve
- https://www.flickr.com/photos/snimages/53209027493/in/photostream/
- http://gsaweb.ast.cam.ac.uk/alerts/alert/Gaia23cmp/
Compared against these, my visual magnitudes estimates compare quite favourably! I am pleasantly surprised how well things worked out. My last measurement, on 2024-01-22, stands out by how much it differs. It is also the measurement I have the least confidence in as by that point I could no longer reliably identify 2023rve in a single 60s exposure. I have some ideas here: take longer exposures or stack my exposures carefully (keeping values linear) and estimate from the stacked image.
Absolute Magnitude
The conversion to absolute magnitude is quite straight-forward as is the subsequent plotting.
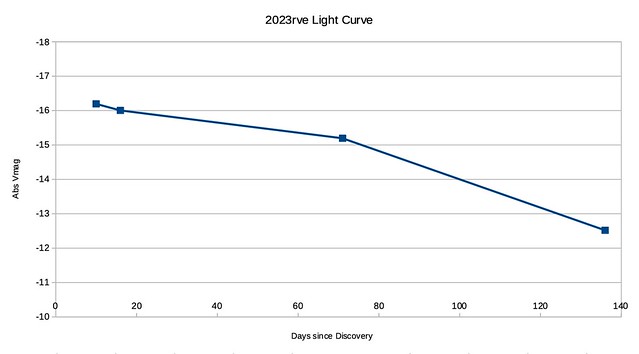
Note that because I don’t know when peak brightness occurred, I am using days-since-discovery instead.
Type II Classification
I don’t think there is enough data yet to definitively say what subtype 2023rve is. More data points will decide the matter and I look forward to the next set of clear skies so I can continue this effort.